Find memory leaks for ROOT object: TObjectTable
ROOT has a special class, called TObjectTable, which optionally keeps track
of all new and delete operations invoked on a ROOT object, or, in other
words, any object that inherits from TObject.
Hooks are present in the TObject constructor and destructor to increment and
decrement a counter for the specific object you are creating or destroying.
This operation is computationally expensive, so you have to manually turn it on
before starting ROOT.
You can create a .rootrc file in the current directory, or edit the
$ROOTSYS/etc/system.rootrc file, and enable the memory and object tracking
like this:
Root.MemStat: 1
Root.ObjectStat: 1
Inside ROOT, you can then tell the program at any point to print the current
number of objects by using the gObjectTable singleton:
$> gObjectTable->Print()
class                     cnt    on heap     size    total size    heap size

TKey                        4          4       72           288          288
TClass                     84         84       80          6720         6720
TDataMember               276        276       24          6624         6624
TObject                    11         11       12           132          132
TMethod                  1974       1974       64        126336       126336
TDataType                  34         34       56          1904         1904
TList                    2328       2328       36         83808        83808
TH1F                        1          1      448           448          448
TText                    2688       2688       56        150528       150528
TGaxis                      1          0      120           120            0
The cnt column is very useful as it gives you the number of instances of a certain class: if you, for instance, forgot to delete an object, you would see that number constantly increasing and you would notice it quite easily.
Remember to turn MemStat and ObjectStat off when done! They are very heavy for production operations.
Valgrind
Valgrind is a complex and robust tool to perform code analysis and profiling.
Valgrind is composed of many tools, each one of them performing a different task. The two tools we are interested in are:
- memcheck: the memory checker
- callgrind: a performance profiler
Installing Valgrind on Ubuntu is easy:
apt install valgrind
On OS X it is easy as well. With Homebrew:
brew install valgrind
Memory check
Memory checks with Valgrind are useful to find the following memory problems:
- invalid memory reads
- invalid memory writes
- potential memory leaks
Valgrind will indicate the potential problems in the logfile it produces. Since it can be hard to understand the logfile, there are also graphical tools showing:
- memory trends (with respect to running time): useful to see when and how the memory grows
- allocation peaks: useful to see which are the parts of your code making the most memory allocations
We recommend using the massif-visualizer tool. On Ubuntu 14.04, it can be installed by getting it from the Kubuntu repositories:
sudo add-apt-repository ppa:kubuntu-ppa/backports
sudo apt-get update
sudo apt-get install massif-visualizer
Run your program under Valgrind's memory check. The following command
is suitable for AliRoot (see man valgrind for more details):
valgrind \
  --tool=memcheck \
  --error-limit=no \
  --max-stackframe=3060888 \
  --suppressions=$ROOTSYS/etc/valgrind-root.supp \
  --leak-check=no \
  --num-callers=40 \
  --log-file=/tmp/valgrind_memory.log \
  root -b -q launchMyAnalysis.C+
A couple of notes.
- The
--suppressionsswitch is used to tell Valgrind which alleged memory problems to ignore. The file we pass to it is the ROOT suppressions file, and greatly simplifies the produced output by reducing false positives. - The
--leak-check=nomakes the execution much faster, but it does not check for memory leaks. Use--leak-check=fullfor a deeper inspection, but expect a longer running time.
Valgrind traps all memory operations through an internal "virtual machine": this is why it can be up to 40 times slow. Run your program under Valgrind on a very small dataset!
To produce data readable with the massif-visualizer, use
--tool=massif, which invokes the
massif heap analyzer
instead of memcheck.
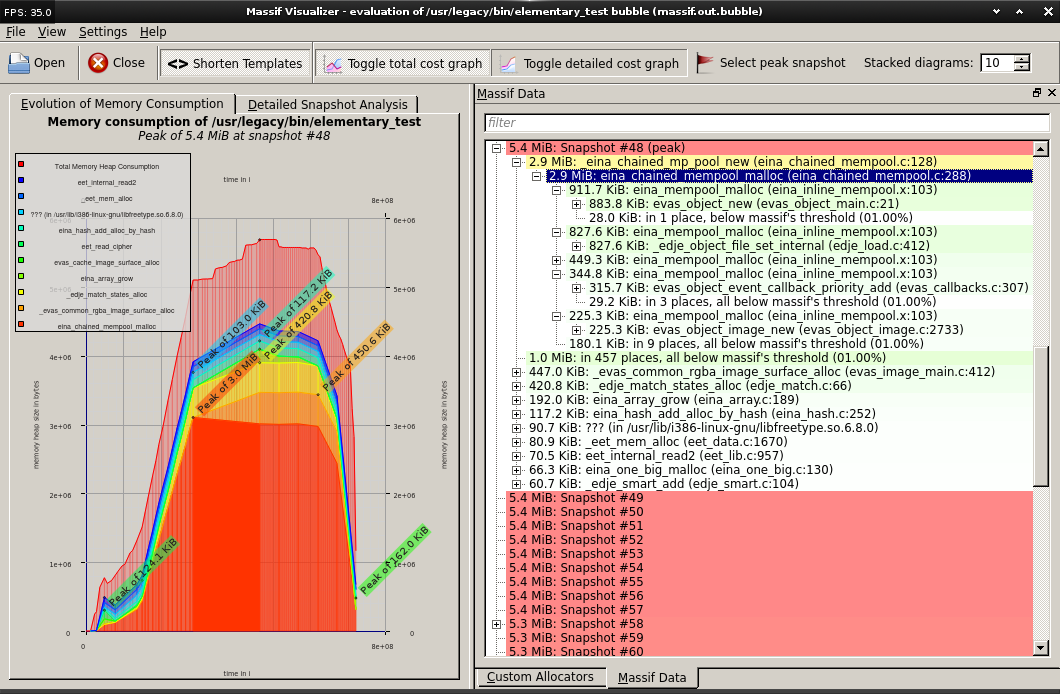
An example of the interactive output produced by massif-visualizer is presented:

Performance profiler
Valgrind has a performance profiler called callgrind. Its purpose is to analyze how much time is spent in each function. As we have already discussed, being a deterministic tool every single function of your program is trapped and captured, which makes the tool very precise, but also very slow.
Callgrind's output can be analyzed by means of the KCachegrind program that can be installed on Ubuntu 14.04 with:
sudo apt install kcachegrind
The typical way of invoking Valgrind's callgrind for Root programs is:
valgrind
  --tool=callgrind \
  --log-file=/tmp/valgrind_callgrind.log \
  root -b -q launchMyAnalysis.C+
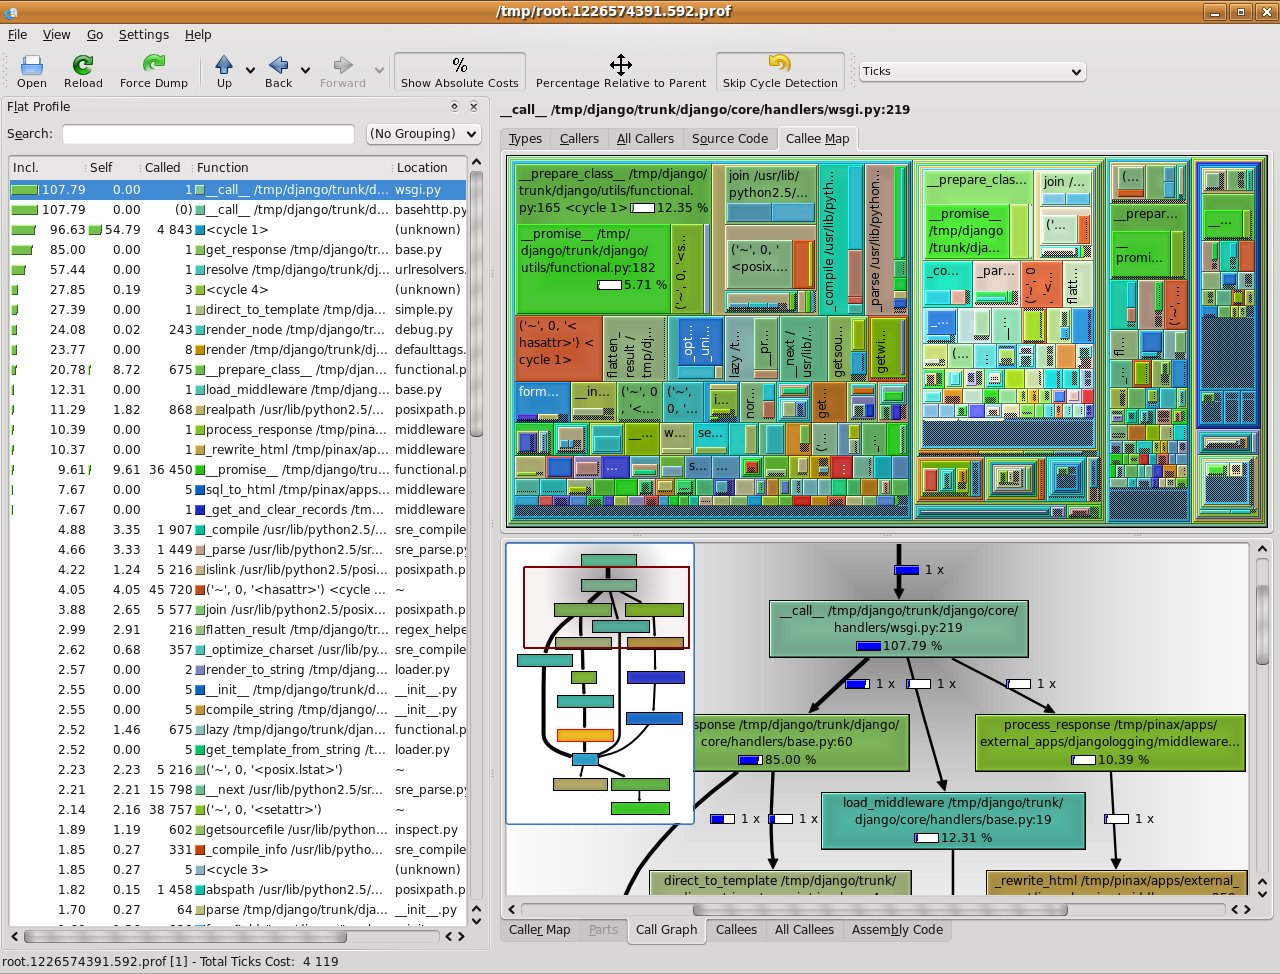
The produced output can be browsed interactively by means of KCachegrind. An output similar to the following is presented:

where colored blocks indentify graphically which are the functions where your program spends most of its time.